Tamil Nadu Assembly Election Result 2026 Map

About Tamil Nadu Assembly Election Result 2026 Map
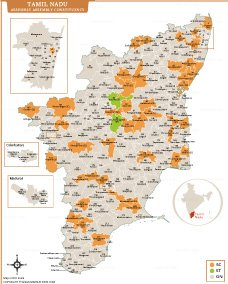
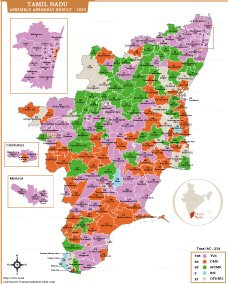
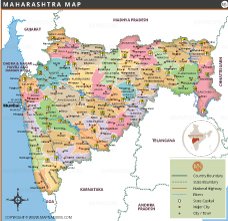
The Tamil Nadu Assembly Election Result 2026 map illustrates constituency wise political outcomes across all 234 assembly constituencies of the state. Different colors represent the electoral performance of major parties including TVK, DMK, AIADMK, INC, and other candidates. The map provides a detailed visual overview of regional voting patterns, party strongholds, and alliance influence throughout Tamil Nadu. Insets highlighting Chennai, Coimbatore, and Madurai urban constituencies offer additional clarity for densely populated regions. This political result map is valuable for election analysis, media reporting, academic research, and public reference, helping users understand the distribution of assembly seats across Tamil Nadu in 2026.
Tamil Nadu Assembly Election Result 2026
| Party | Won | Leading | Total |
|---|---|---|---|
| Tamilaga Vettri Kazhagam - TVK | 108 | 0 | 108 |
| Dravida Munnetra Kazhagam - DMK | 59 | 0 | 59 |
| All India Anna Dravida Munnetra Kazhagam - ADMK | 47 | 0 | 47 |
| Indian National Congress - INC | 5 | 0 | 5 |
| Pattali Makkal Katchi - PMK | 4 | 0 | 4 |
| Indian Union Muslim League - IUML | 2 | 0 | 2 |
| Communist Party of India - CPI | 2 | 0 | 2 |
| Viduthalai Chiruthaigal Katchi - VCK | 2 | 0 | 2 |
| Communist Party of India (Marxist) - CPI(M) | 2 | 0 | 2 |
| Bharatiya Janata Party - BJP | 1 | 0 | 1 |
| Desiya Murpokku Dravida Kazhagam - DMDK | 1 | 0 | 1 |
| Amma Makkal Munnettra Kazagam - AMMKMNKZ | 1 | 0 | 1 |
| Total | 234 | 0 | 234 |
TAMIL NADU MAPS

INDIA STATE MAPS


WORLD COUNTRIES
- Afghanistan
- Albania
- Algeria
- Andorra
- Angola
- Antigua and Barbuda
- Argentina
- Armenia
- Australia
- Austria
- Azerbaijan
- Bahrain
- Bangladesh
- Barbados
- Belarus
- Belgium
- Belize
- Benin
- Bhutan
- Bolivia
- Bosnia and Herzegovina
- Botswana
- Brazil
- Brunei
- Bulgaria
- Burkina Faso
- Burma (Myanmar)
- Burundi
- Cabo Verde
- Cambodia
- Cameroon
- Canada
- Central African Republic
- Chad
- Chile
- China
- Colombia
- Comoros Islands
- Democratic Republic of the Congo
- Costa Rica
- Cote d'Ivoire
- Croatia
- Cuba
- Cyprus
- Czechia
- Denmark
- Djibouti
- Dominica
- Dominican Republic
- Ecuador
- Egypt
- El Salvador
- England
- Equatorial Guinea
- Eritrea
- Estonia
- eSwatini (formerly Swaziland)
- Ethiopia
- Federated States of Micronesia
- Fiji
- Finland
- France
- Gabon
- The Gambia
- Georgia
- Germany
- Ghana
- Greece
- Grenada
- Guatemala
- Guinea
- Guinea-Bissau
- Guyana
- Haiti
- Holy See
- Honduras
- Hungary
- Iceland
- India
- Indonesia
- Iran
- Iraq
- Ireland
- Israel
- Italy
- Jamaica
- Japan
- Jordan
- Kazakhstan
- Kenya
- Kiribati
- Kosovo
- Kuwait
- Kyrgyzstan
- Laos
- Latvia
- Lebanon
- Lesotho
- Liberia
- Libya
- Liechtenstein
- Lithuania
- Luxembourg
- Madagascar
- Malawi
- Malaysia
- Maldives
- Mali
- Malta
- Marshall Islands
- Mauritania
- Mauritius
- Mexico
- Moldova
- Monaco
- Mongolia
- Montenegro
- Morocco
- Mozambique
- Namibia
- Nauru
- Nepal
- Netherlands
- New Zealand
- Nicaragua
- Niger
- Nigeria
- North Korea
- Northern Ireland
- Norway
- Oman
- Pakistan
- Palau
- Panama
- Papua New Guinea
- Paraguay
- Peru
- Philippines
- Poland
- Portugal
- Puerto Rico (USA)
- Qatar
- North Macedonia
- Romania
- Russia
- Rwanda
- Saint Kitts and Nevis
- Saint Lucia
- Saint Vincent & the Grenadines
- Samoa
- San Marino
- Sao Tome and Principe
- Saudi Arabia
- Scotland
- Senegal
- Serbia
- Seychelles
- Sierra Leone
- Singapore
- Slovakia
- Slovenia
- Solomon Islands
- Somalia
- South Africa
- South Korea
- South Sudan
- Spain
- Sri Lanka
- Sudan
- Suriname
- Sweden
- Switzerland
- Syria
- Tajikistan
- Taiwan
- Tanzania
- Thailand
- The Bahamas
- Timor-Leste
- Togo
- Tonga
- Trinidad and Tobago
- Tunisia
- Turkey
- Turkmenistan
- Tuvalu
- Uganda
- Ukraine
- United Arab Emirates
- United Kingdom
- United States of America
- Uruguay
- Uzbekistan
- Vanuatu
- Western Sahara
- Venezuela
- Vietnam
- Wales
- Yemen
- Zambia
- Zimbabwe
