Top 10 Carbon Emission Countries Map
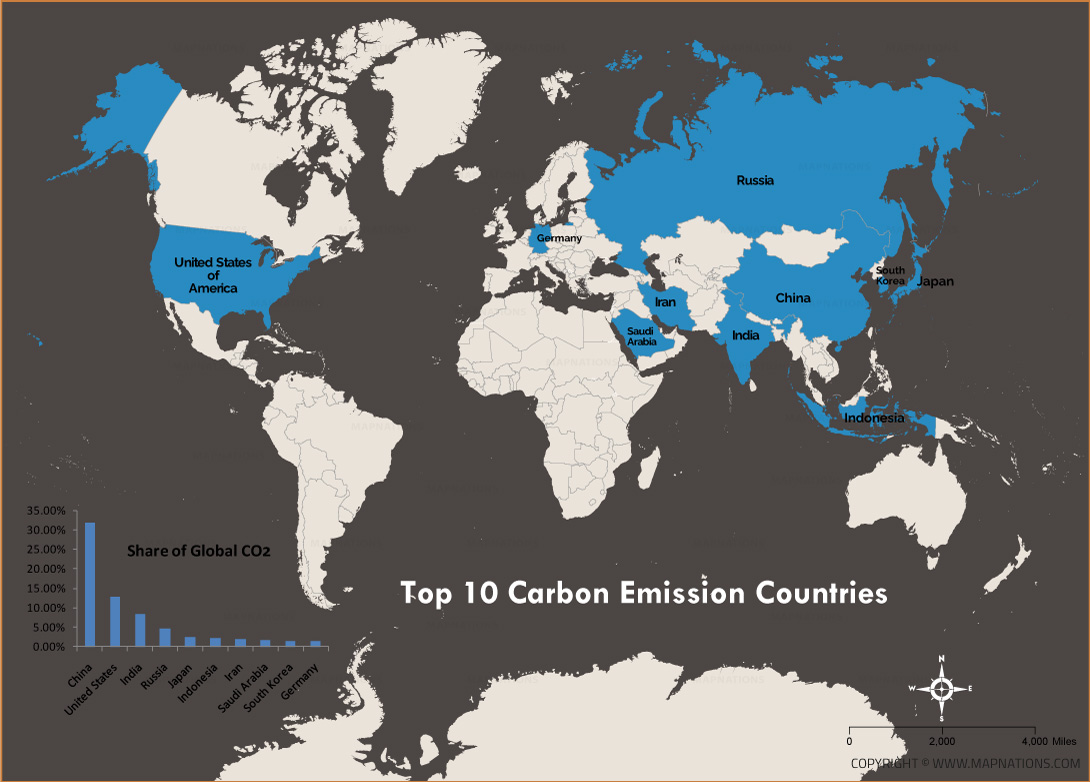
This map highlights the world’s top 10 carbon emission countries and compares their shares of global CO2 emissions for understanding.
About Top 10 Carbon Emission Countries Map
The Top 10 Carbon Emission Countries map highlights the nations responsible for the largest shares of global carbon dioxide emissions. The map identifies China, the United States, India, Russia, Japan, Indonesia, Iran, Saudi Arabia, South Korea, and Germany as the leading emitters. China has the largest share, followed by the United States and India, while Russia, Japan, Indonesia, and Iran contribute significant amounts. Saudi Arabia, South Korea, and Germany complete the top ten. The blue-highlighted countries make their locations easy to identify on the world map, while the accompanying bar chart compares their shares of global CO2 emissions. This map is useful for students, researchers, teachers, environmental studies, geography projects, and anyone interested in understanding the distribution of carbon emissions.
Top 10 Carbon Emission Countries
| Rank | Country | CO2 Emissions 2024 | Share of Global CO2 |
|---|---|---|---|
| 1 | China | 12.29 billion tonnes | 31.84% |
| 2 | United States | 4.90 billion tonnes | 12.71% |
| 3 | India | 3.19 billion tonnes | 8.27% |
| 4 | Russia | 1.78 billion tonnes | 4.61% |
| 5 | Japan | 961.87 million tonnes | 2.49% |
| 6 | Indonesia | 812.22 million tonnes | 2.10% |
| 7 | Iran | 792.63 million tonnes | 2.05% |
| 8 | Saudi Arabia | 692.13 million tonnes | 1.79% |
| 9 | South Korea | 583.68 million tonnes | 1.51% |
| 10 | Germany | 572.32 million tonnes | 1.48% |




- Afghanistan
- Albania
- Algeria
- Andorra
- Angola
- Antigua and Barbuda
- Argentina
- Armenia
- Australia
- Austria
- Azerbaijan
- Bahrain
- Bangladesh
- Barbados
- Belarus
- Belgium
- Belize
- Benin
- Bhutan
- Bolivia
- Bosnia and Herzegovina
- Botswana
- Brazil
- Brunei
- Bulgaria
- Burkina Faso
- Burma (Myanmar)
- Burundi
- Cabo Verde
- Cambodia
- Cameroon
- Canada
- Central African Republic
- Chad
- Chile
- China
- Colombia
- Comoros Islands
- Democratic Republic of the Congo
- Costa Rica
- Cote d'Ivoire
- Croatia
- Cuba
- Cyprus
- Czechia
- Denmark
- Djibouti
- Dominica
- Dominican Republic
- Ecuador
- Egypt
- El Salvador
- England
- Equatorial Guinea
- Eritrea
- Estonia
- eSwatini (formerly Swaziland)
- Ethiopia
- Federated States of Micronesia
- Fiji
- Finland
- France
- Gabon
- The Gambia
- Georgia
- Germany
- Ghana
- Greece
- Grenada
- Guatemala
- Guinea
- Guinea-Bissau
- Guyana
- Haiti
- Holy See
- Honduras
- Hungary
- Iceland
- India
- Indonesia
- Iran
- Iraq
- Ireland
- Israel
- Italy
- Jamaica
- Japan
- Jordan
- Kazakhstan
- Kenya
- Kiribati
- Kosovo
- Kuwait
- Kyrgyzstan
- Laos
- Latvia
- Lebanon
- Lesotho
- Liberia
- Libya
- Liechtenstein
- Lithuania
- Luxembourg
- Madagascar
- Malawi
- Malaysia
- Maldives
- Mali
- Malta
- Marshall Islands
- Mauritania
- Mauritius
- Mexico
- Moldova
- Monaco
- Mongolia
- Montenegro
- Morocco
- Mozambique
- Namibia
- Nauru
- Nepal
- Netherlands
- New Zealand
- Nicaragua
- Niger
- Nigeria
- North Korea
- Northern Ireland
- Norway
- Oman
- Pakistan
- Palau
- Panama
- Papua New Guinea
- Paraguay
- Peru
- Philippines
- Poland
- Portugal
- Puerto Rico (USA)
- Qatar
- North Macedonia
- Romania
- Russia
- Rwanda
- Saint Kitts and Nevis
- Saint Lucia
- Saint Vincent & the Grenadines
- Samoa
- San Marino
- Sao Tome and Principe
- Saudi Arabia
- Scotland
- Senegal
- Serbia
- Seychelles
- Sierra Leone
- Singapore
- Slovakia
- Slovenia
- Solomon Islands
- Somalia
- South Africa
- South Korea
- South Sudan
- Spain
- Sri Lanka
- Sudan
- Suriname
- Sweden
- Switzerland
- Syria
- Tajikistan
- Taiwan
- Tanzania
- Thailand
- The Bahamas
- Timor-Leste
- Togo
- Tonga
- Trinidad and Tobago
- Tunisia
- Turkey
- Turkmenistan
- Tuvalu
- Uganda
- Ukraine
- United Arab Emirates
- United Kingdom
- United States of America
- Uruguay
- Uzbekistan
- Vanuatu
- Western Sahara
- Venezuela
- Vietnam
- Wales
- Yemen
- Zambia
- Zimbabwe