India Population Density Map

About India Population Density Estimates 2025-26
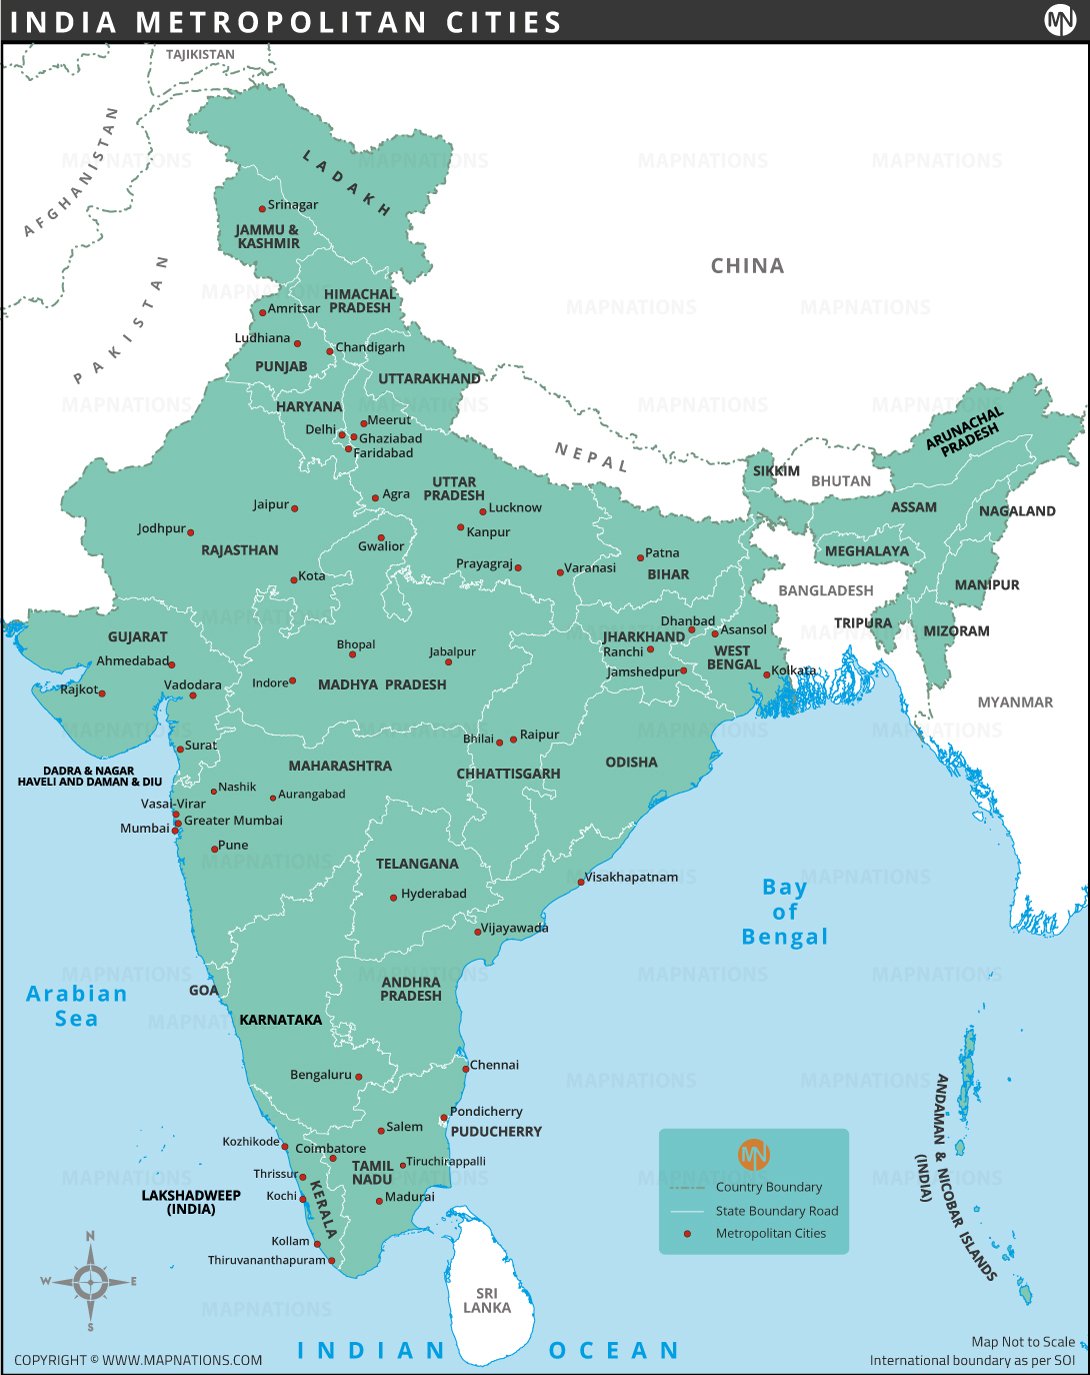
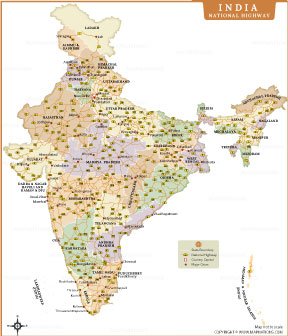
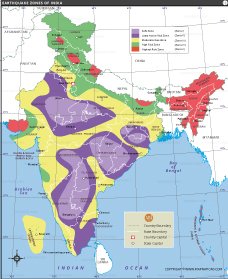
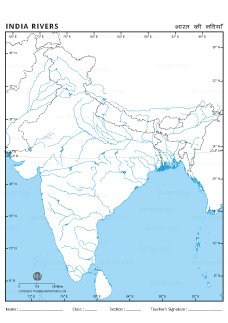
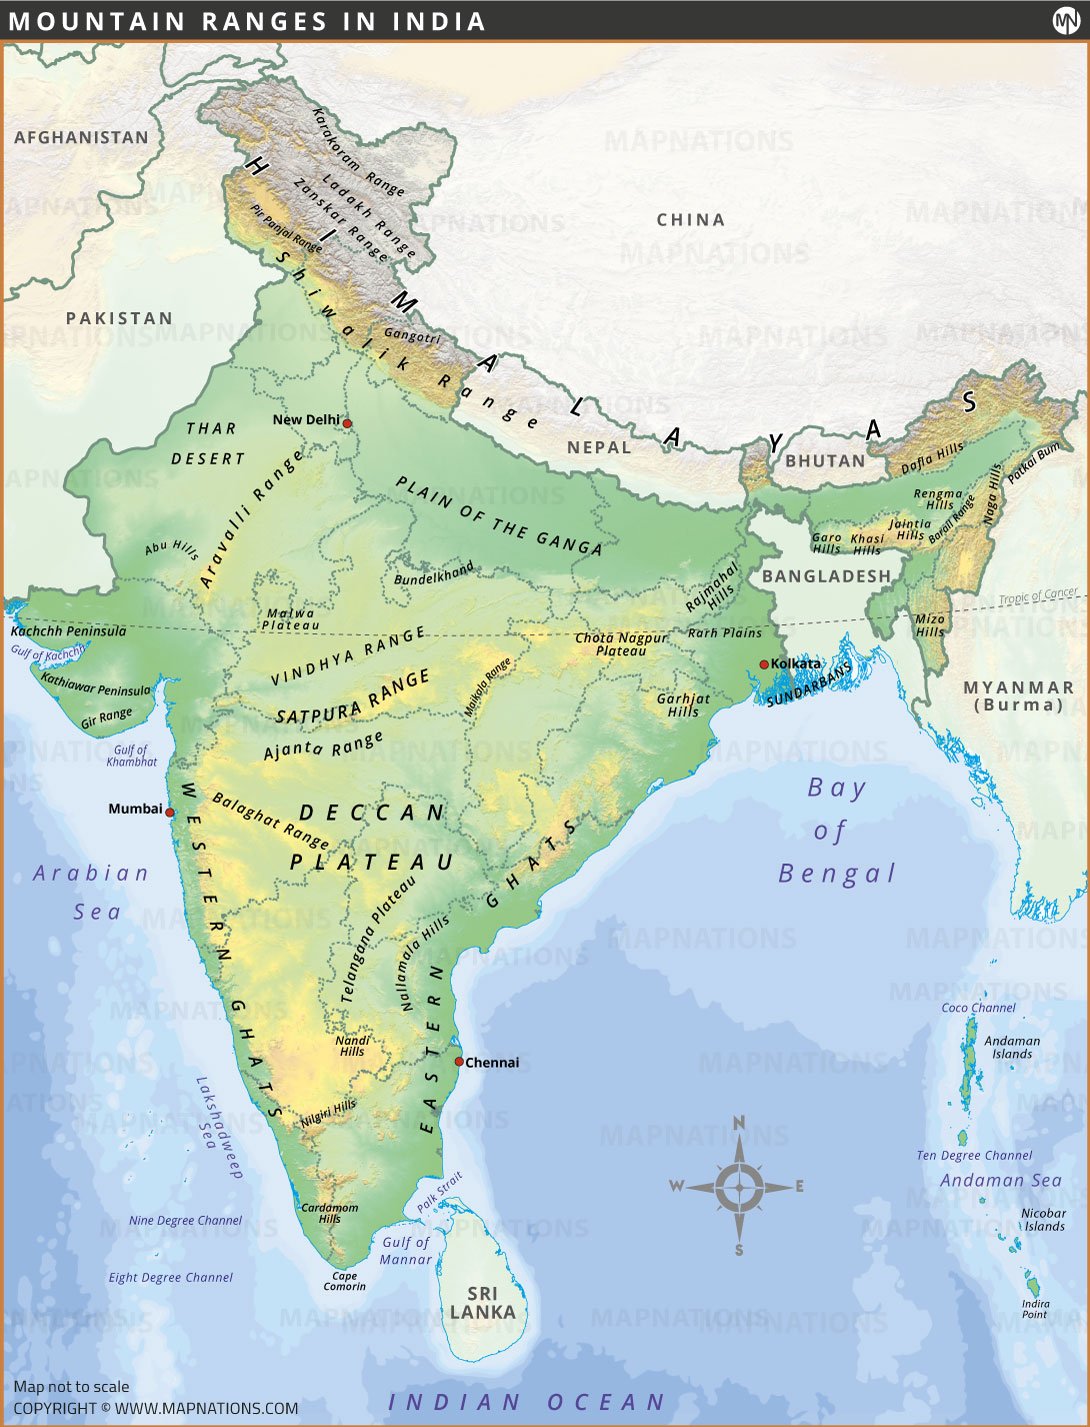
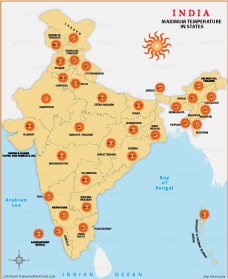
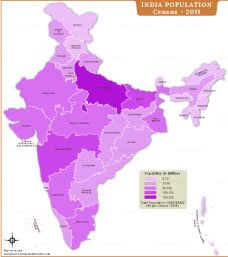
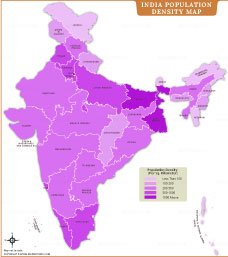
This India Population Density Map highlights the population distribution across Indian states and union territories using different color shades. Darker regions represent highly populated areas such as Bihar, West Bengal, Delhi, and Uttar Pradesh, while lighter shades indicate sparsely populated regions including Arunachal Pradesh, Ladakh, and parts of Northeast India. The map helps viewers understand demographic concentration, urban growth, and settlement patterns throughout the country. It is useful for students, researchers, educators, and geography enthusiasts studying India’s population trends and regional variations. The map provides a clear visual representation of population density per square kilometer across India.
India Population Density
| States | Population Density (Estimates 2025-26) |
|---|---|
| Delhi (UT) | 16,900+ |
| Chandigarh (UT) | 10,500+ |
| Puducherry (UT) | 4,350+ |
| Lakshadweep (UT) | 2,680+ |
| Bihar | 1,170+ |
| West Bengal | 1,120+ |
| Uttar Pradesh | 987+ |
| Kerala | 945+ |
| Haryana | 672+ |
| Goa | 611+ |
| Punjab | 606+ |
| Tamil Nadu | 547+ |
| Jharkhand | 452+ |
| Assam | 440+ |
| Maharashtra | 420+ |
| Tripura | 387+ |
| Gujarat | 341+ |
| Karnataka | 340+ |
| Telangana | 335+ |
| Andhra Pradesh | 320+ |
| Odisha | 290+ |
| Madhya Pradesh | 260+ |
| Rajasthan | 220+ |
| Uttarakhand | 205+ |
| Chhattisgarh | 205+ |
| Jammu & Kashmir (UT) | 140+ |
| Meghalaya | 140+ |
| Himachal Pradesh | 140+ |
| Manipur | 135+ |
| Nagaland | 130+ |
| Dadra & Nagar Haveli and Daman & Diu (UT) | 125+ |
| Sikkim | 95+ |
| Mizoram | 60+ |
| Andaman & Nicobar Islands (UT) | 50+ |
| Arunachal Pradesh | 20+ |
| Ladakh (UT) | 5+ |
INDIA MAPS


WORLD COUNTRIES
- Afghanistan
- Albania
- Algeria
- Andorra
- Angola
- Antigua and Barbuda
- Argentina
- Armenia
- Australia
- Austria
- Azerbaijan
- Bahrain
- Bangladesh
- Barbados
- Belarus
- Belgium
- Belize
- Benin
- Bhutan
- Bolivia
- Bosnia and Herzegovina
- Botswana
- Brazil
- Brunei
- Bulgaria
- Burkina Faso
- Burma (Myanmar)
- Burundi
- Cabo Verde
- Cambodia
- Cameroon
- Canada
- Central African Republic
- Chad
- Chile
- China
- Colombia
- Comoros Islands
- Democratic Republic of the Congo
- Costa Rica
- Cote d'Ivoire
- Croatia
- Cuba
- Cyprus
- Czechia
- Denmark
- Djibouti
- Dominica
- Dominican Republic
- Ecuador
- Egypt
- El Salvador
- England
- Equatorial Guinea
- Eritrea
- Estonia
- eSwatini (formerly Swaziland)
- Ethiopia
- Federated States of Micronesia
- Fiji
- Finland
- France
- Gabon
- The Gambia
- Georgia
- Germany
- Ghana
- Greece
- Grenada
- Guatemala
- Guinea
- Guinea-Bissau
- Guyana
- Haiti
- Holy See
- Honduras
- Hungary
- Iceland
- India
- Indonesia
- Iran
- Iraq
- Ireland
- Israel
- Italy
- Jamaica
- Japan
- Jordan
- Kazakhstan
- Kenya
- Kiribati
- Kosovo
- Kuwait
- Kyrgyzstan
- Laos
- Latvia
- Lebanon
- Lesotho
- Liberia
- Libya
- Liechtenstein
- Lithuania
- Luxembourg
- Madagascar
- Malawi
- Malaysia
- Maldives
- Mali
- Malta
- Marshall Islands
- Mauritania
- Mauritius
- Mexico
- Moldova
- Monaco
- Mongolia
- Montenegro
- Morocco
- Mozambique
- Namibia
- Nauru
- Nepal
- Netherlands
- New Zealand
- Nicaragua
- Niger
- Nigeria
- North Korea
- Northern Ireland
- Norway
- Oman
- Pakistan
- Palau
- Panama
- Papua New Guinea
- Paraguay
- Peru
- Philippines
- Poland
- Portugal
- Puerto Rico (USA)
- Qatar
- North Macedonia
- Romania
- Russia
- Rwanda
- Saint Kitts and Nevis
- Saint Lucia
- Saint Vincent & the Grenadines
- Samoa
- San Marino
- Sao Tome and Principe
- Saudi Arabia
- Scotland
- Senegal
- Serbia
- Seychelles
- Sierra Leone
- Singapore
- Slovakia
- Slovenia
- Solomon Islands
- Somalia
- South Africa
- South Korea
- South Sudan
- Spain
- Sri Lanka
- Sudan
- Suriname
- Sweden
- Switzerland
- Syria
- Tajikistan
- Taiwan
- Tanzania
- Thailand
- The Bahamas
- Timor-Leste
- Togo
- Tonga
- Trinidad and Tobago
- Tunisia
- Turkey
- Turkmenistan
- Tuvalu
- Uganda
- Ukraine
- United Arab Emirates
- United Kingdom
- United States of America
- Uruguay
- Uzbekistan
- Vanuatu
- Western Sahara
- Venezuela
- Vietnam
- Wales
- Yemen
- Zambia
- Zimbabwe